Download PDF Report >>> Medical Loss Ratio
Medical Loss Ratio or MLR is a ratio used to measure what percent of Premium revenue for health insurance is paid out in medical claims. The remainder of premium is used to cover selling, general and administrative (SG&A) expenses as well as operating margin or profit.
In the early 1990’s, the average MLR was over 90% and in 1992-1993 the MLR approached 95%. Though that may have been a high water mark for MLR, it was not unusual for MLRs in the 1980’s and earlier to be above 90%. Health insurance companies ran the business with leaner overhead than is seen in more current times.
Wall Street frequently uses the Medical Loss Ratio measure to determine profitability for health Insurers. For Wall Street, a lower MLR is considered good as it indicates that the insurer has control over its medical claims. Higher MLR’s may
suggest that the insurer either has a bad book of business or is not so well managed, either or both which could adversely affect profitability.
MLR’s dropped fairly rapidly in the 1990’s and continued a more gradual decline to the low 80% levels in recent years.
Health care reformers have focused on increasing MLR’s as a way to control health care costs. Since MLR by definition is a ratio of two numbers, one can increase the MLR by either reducing premium revenue, or by paying more claims from the same revenue. Since no one arbitrarily pays claims, forcing an increase in the MLR should put downward pressure on premiums. In that case, what expenses need to be cut.
For them to focus on reducing claims does them little good as lowering claims does nothing to increase the MLR. For insurers to retain some measure of profitability, they have to look at cutting their general and administrative expenses.
Medical Loss Ratio declining over time
The graph below shows MLR trends from 1992 to 2007. In the early 1990’s, the average MLR was over 90% and in 1992-1993 the MLR approached 95%. Though that may have been a high water mark for MLR, it was not unusual for MLRs before 1990 to be above 90%. Then again, as one goes back in time, more health insurers were non-profit than there are now. These companies ran the business with leaner overhead than is seen in more current times.
A critical question for health care reform is how fast and how far can these trends be reversed so that more of the premium dollar goes to medical claims instead of overhead expenses and profits.
 Source: Price Waterhouse Coopers Medical Loss Ratio Annual
MLR includes multiple variables to control
The graph below shows three cases, each with three bars. The base case is typical of today, the second assumes lower claims, and the third assumes higher claims.
The first bar in each case represents claims, SG&A expense and profit margin. The second bar represents premiums and a small investment income (green). By definition, profit plus expenses must equal revenue so those two bars are always equal length. The third bar of each case is the MLR.
In the second case, claims are lower. But unless premiums are reduced, the MLR will go down. Further the premium reduction will eat into profits to maintain the MLR. If claims rise as in the third case, and if the market will bear, higher premiums will generate added profits without incurring a reduction in MLR.
Effect on MLR if profits & expenses held constant
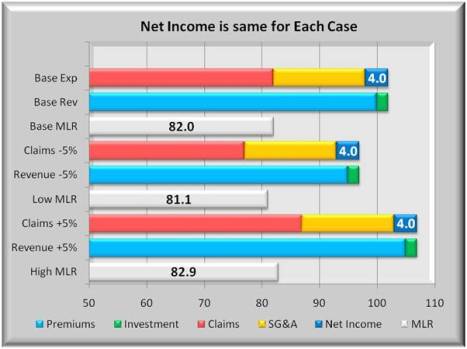
The graph below shows the same three case format as the prior graph. The base case is the same as above. In the second case, however, both claims and premiums are reduced by 5%. It also assumes no change in profit or expense. In an environment of falling costs and claims, the MLR will decline by nearly one %.
But the health care prices have been in an ever increasing trend. If overhead and profits are held constant, a 5% increase in both claims and premiums will raise the MLR by almost 1%. But as was shown above, the MLR continues to decline. Unless there is competitive downward pressure on premiums, the profits will tend to rise and MLR’s decline.
A key unanswered question is whether there exists enough competition to drive prices down or at least keep them from rising faster than general inflation. 
Raise the minimum MLR as a step to Cost Control
California is one state that is considering raising the MLR to a minimum of 85%, and increase from about 82%. The graph below shows two ways this can occur.
The first is to hold premiums constant as claims rise to 85%. This will result in significantly lower profits unless overhead is sharply reduced, from around 16% to 13%.
The second method is to reduce premiums to more quickly reach 85% MLR with no changes in claims. If insurers want to maintain current levels of profits, this method will require even steeper cuts in overhead expenses than in the prior case. Insurers can be expected to resist these moves.
Still, one does not have to go back that many years to find total overhead and profit to be less than 10%.
Sensitivity in MLR to changes in overhead and profit
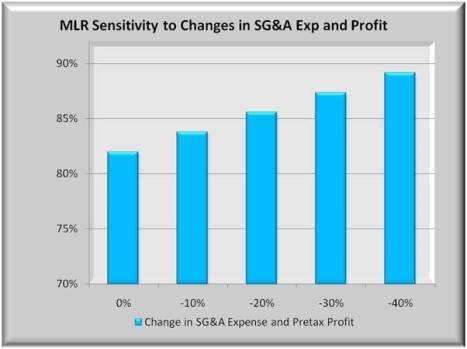
The graph below shows 5 bars representing decreasing levels of overhead and profit and their effect on MLR. Or conversely, how much do overhead and profit need to be reduced to reach higher MLR levels.
For insurers to reach an 85% MLR without increasing premiums, they will need to reduce overhead and profits by some 20%. An 88% minimum MLR would require reductions of 33%. Health care reform should allow for significant cuts in general and administrative expenses. With insurance exchanges, selling expenses may be reduced. But it is hard to imagine the levels of cuts needed to help bring about cost control without some reduction in profits as well.
If this nation is serious about reform, it is optimistic to think that insurers’ profits will remain relatively unaffected by these changes. But the high tech industry had a nice ride to new highs, before it was brought back to reasonable levels.
Download PDF Report >>> Medical Loss Ratio
Filed under: Analyses, Healthcare Reform, MLR - Financial Ratios | Tagged: 95% MLR, claims, cost control, MLR, non-profit, overhead, Premiums |


Leave a comment